Anatomy of Attention Sinks in Vision Transformers
A Mechanistic Dissection Across Vision Transformers
In large language models (LLMs), attention sinks are a well-documented curiosity: certain tokens — usually the first one — absorb a wildly disproportionate share of attention regardless of what the input says. The phenomenon is consistent across LLM families, scales, and training recipes. Naturally, the field has assumed the same thing happens in vision transformers: one phenomenon, one explanation, case closed.
We find that this assumption is wrong.
We mechanistically dissected attention sinks across five major vision transformer families — DINOv2, Depth Anything V2 (fine-tuned from DINOv2), CLIP, SigLIP, and DiT — and discovered that what looks like the same behavior on the surface is actually produced by fundamentally different mechanisms. Even more surprising: the prevailing explanation for why sinks form turns out to be backwards.
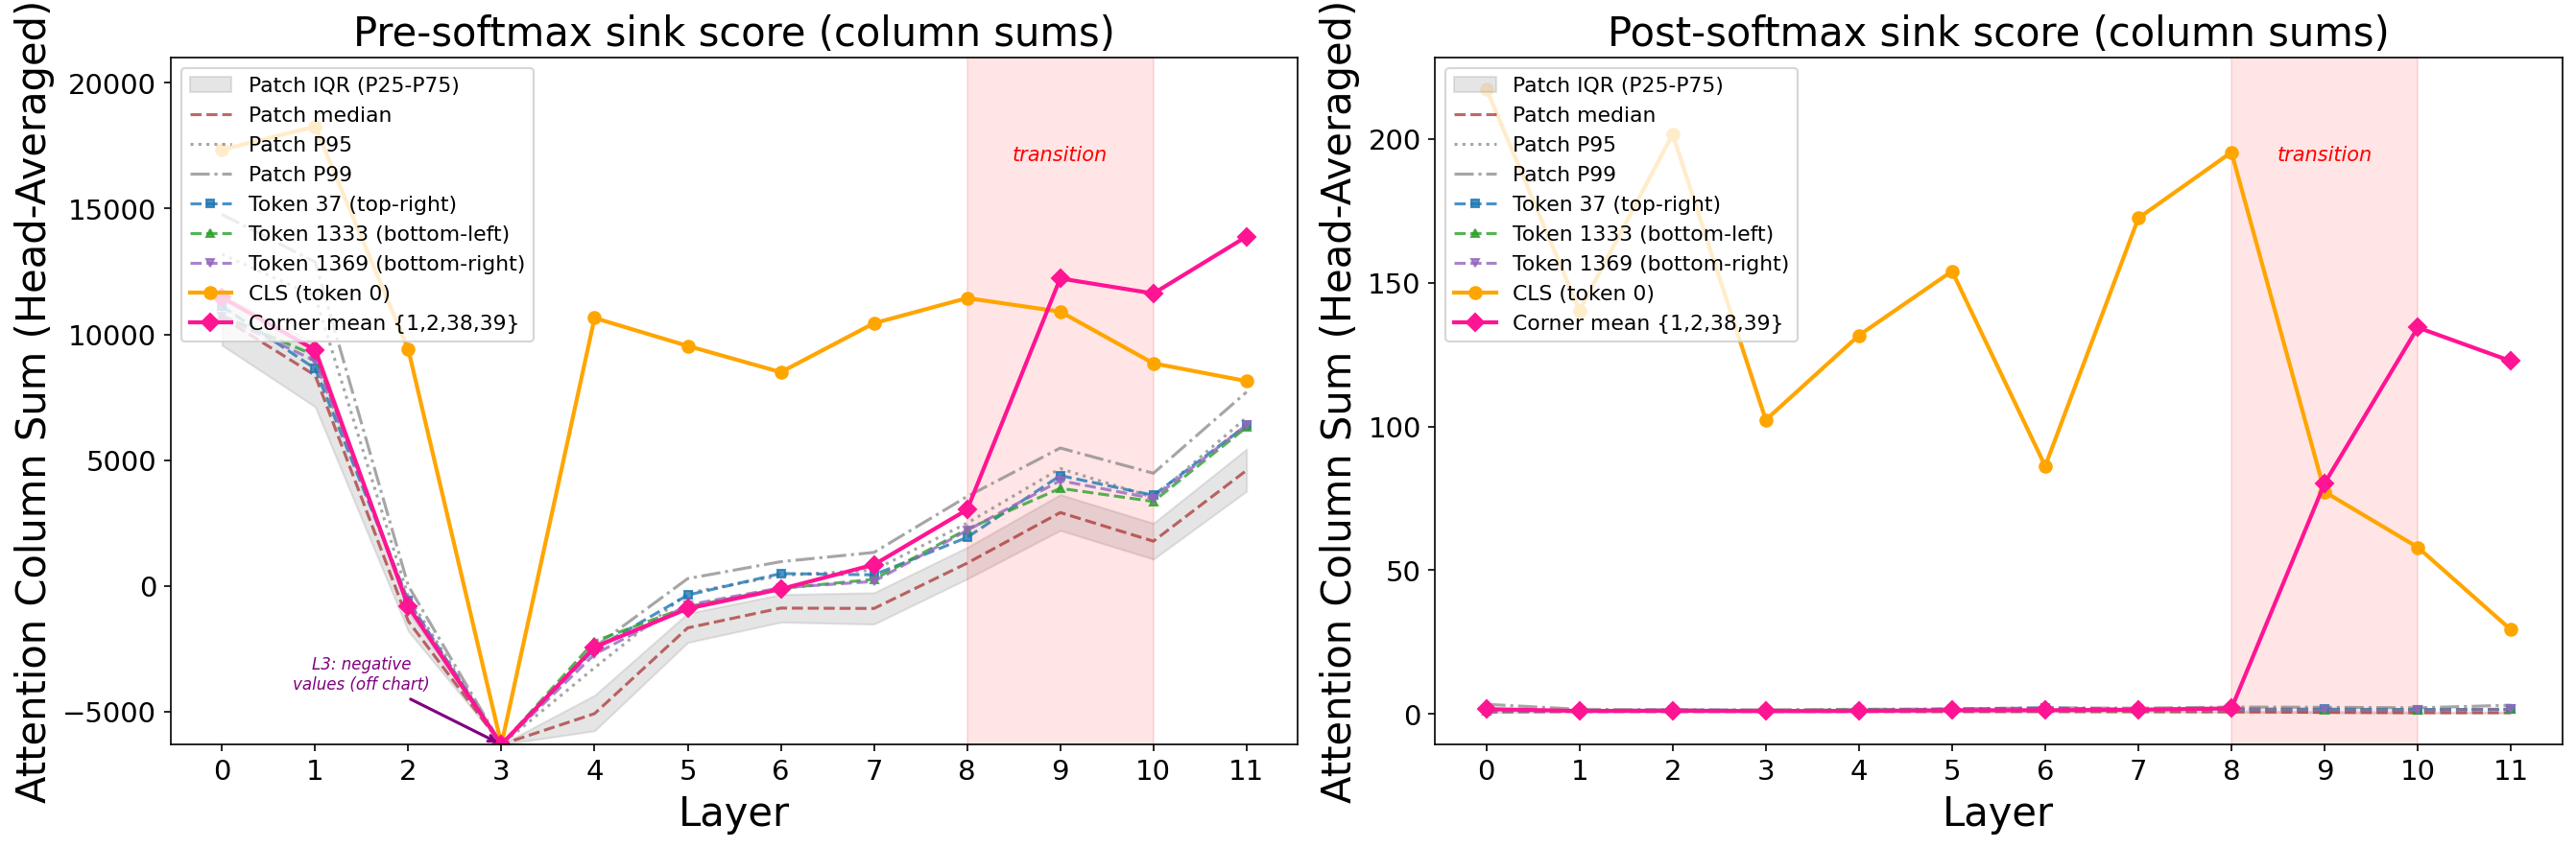
But first — what exactly is an attention sink? In a transformer, each token attends to every other token via the attention matrix $A \in \mathbb{R}^{N \times N}$. Each row describes how one token gathers information; each column describes how one token contributes information to others. We measure a token’s “sink score” as its column sum:
\[c_j = \sum_{i=1}^{N} A_{i,j}\]Since each row sums to 1 after softmax, the expected column sum under uniform attention is 1.0 — a column sum far greater than 1 means many tokens are disproportionately attending to token $j$. We quantify this with the concentration ratio: $r = \max_j c_j \;/\; \text{median}_j \, c_j$. A ratio of 100x means the strongest sink receives 100 times more attention than a typical token.
Attention Sinks Behave Differently in Vision Transformers
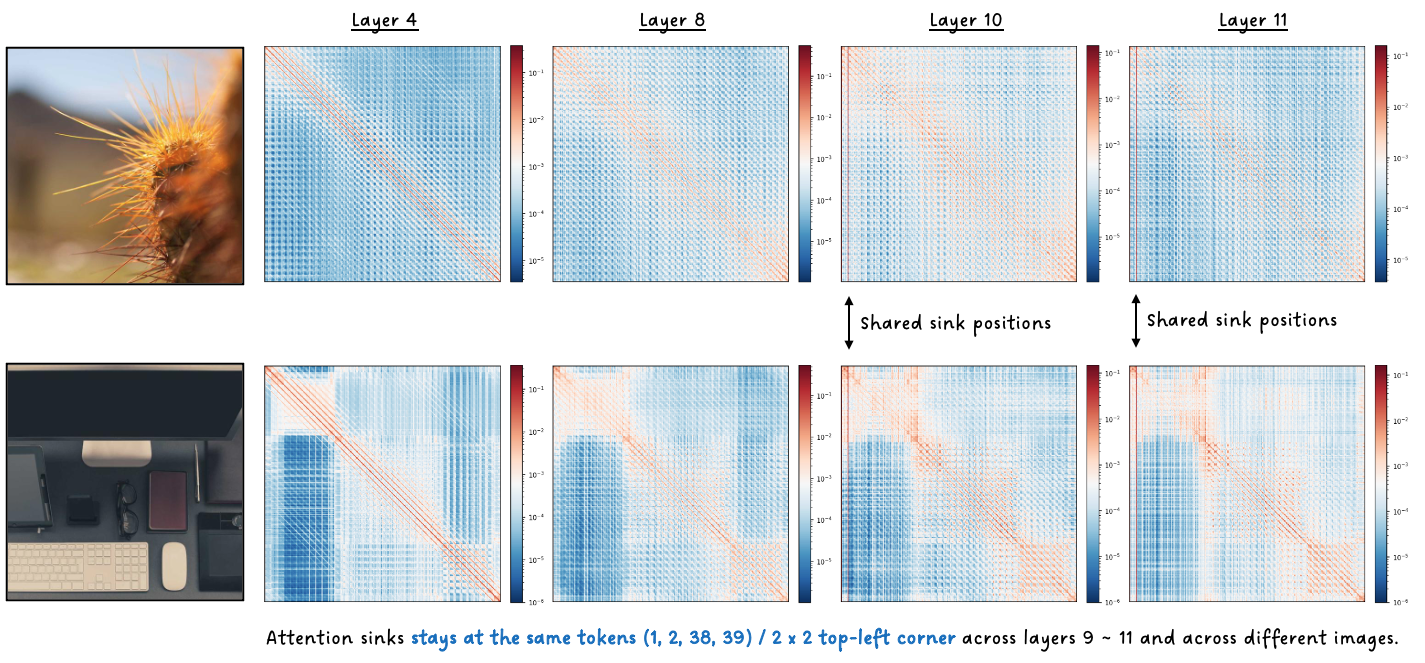
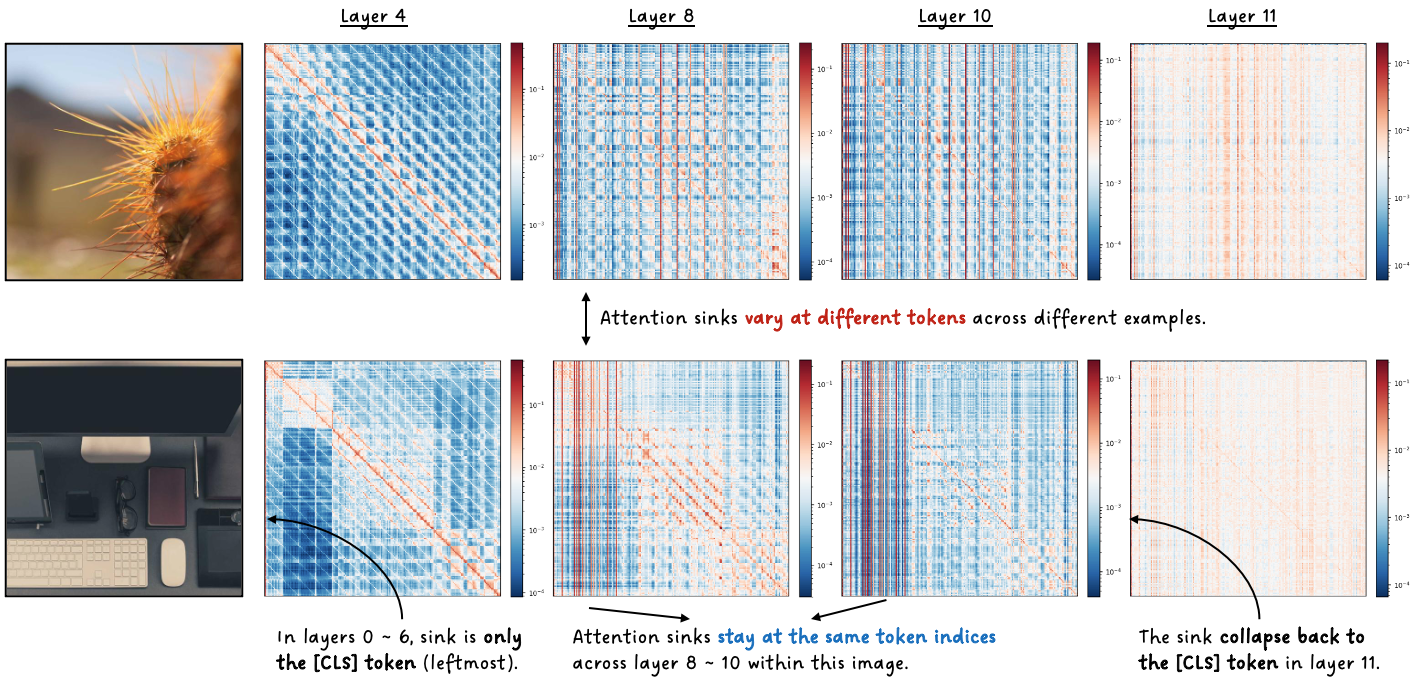
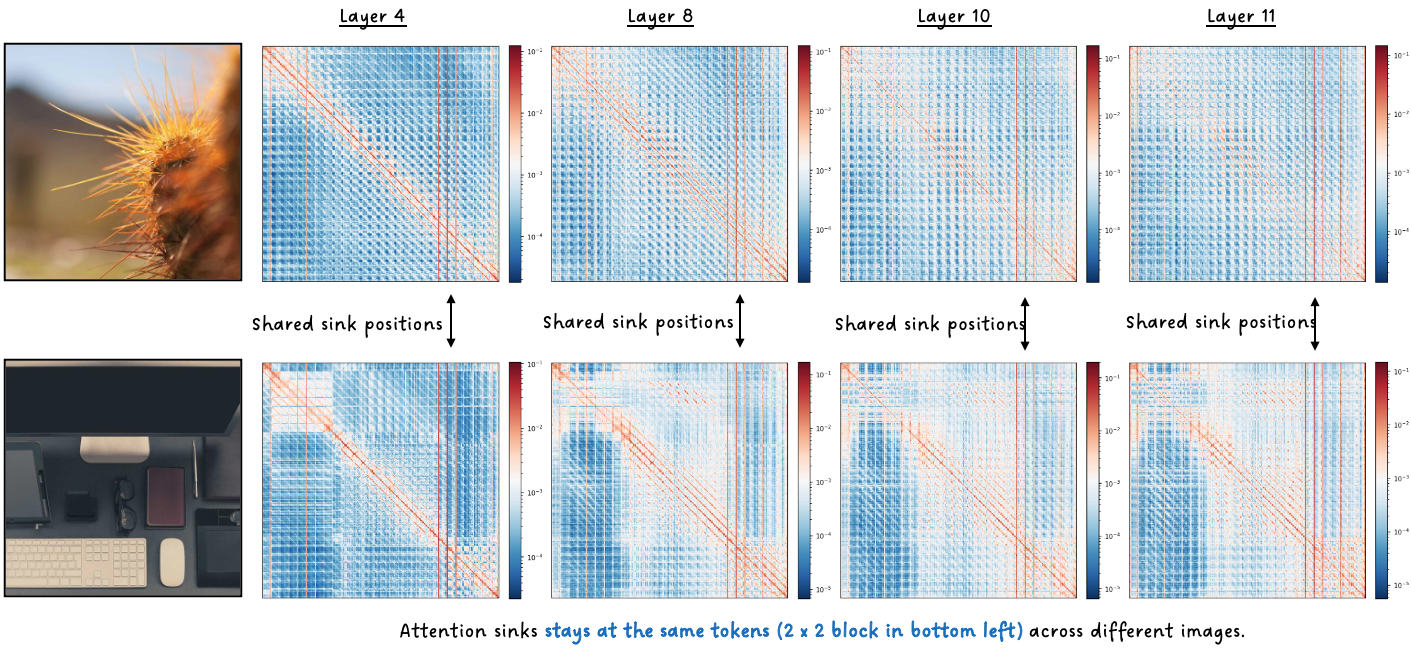
Here’s what attention sinks look like across four models when you track them layer by layer. Red vertical lines in the attention maps indicate tokens with high column sums — these are the attention sinks.
DINOv2: Four corner (top left 2 $\times$2) patch tokens quietly accumulate attention for eight layers, then suddenly explode — their residual norms spike 48x and they absorb up to 292x more attention than the median token. This same pattern is persistent across all images.
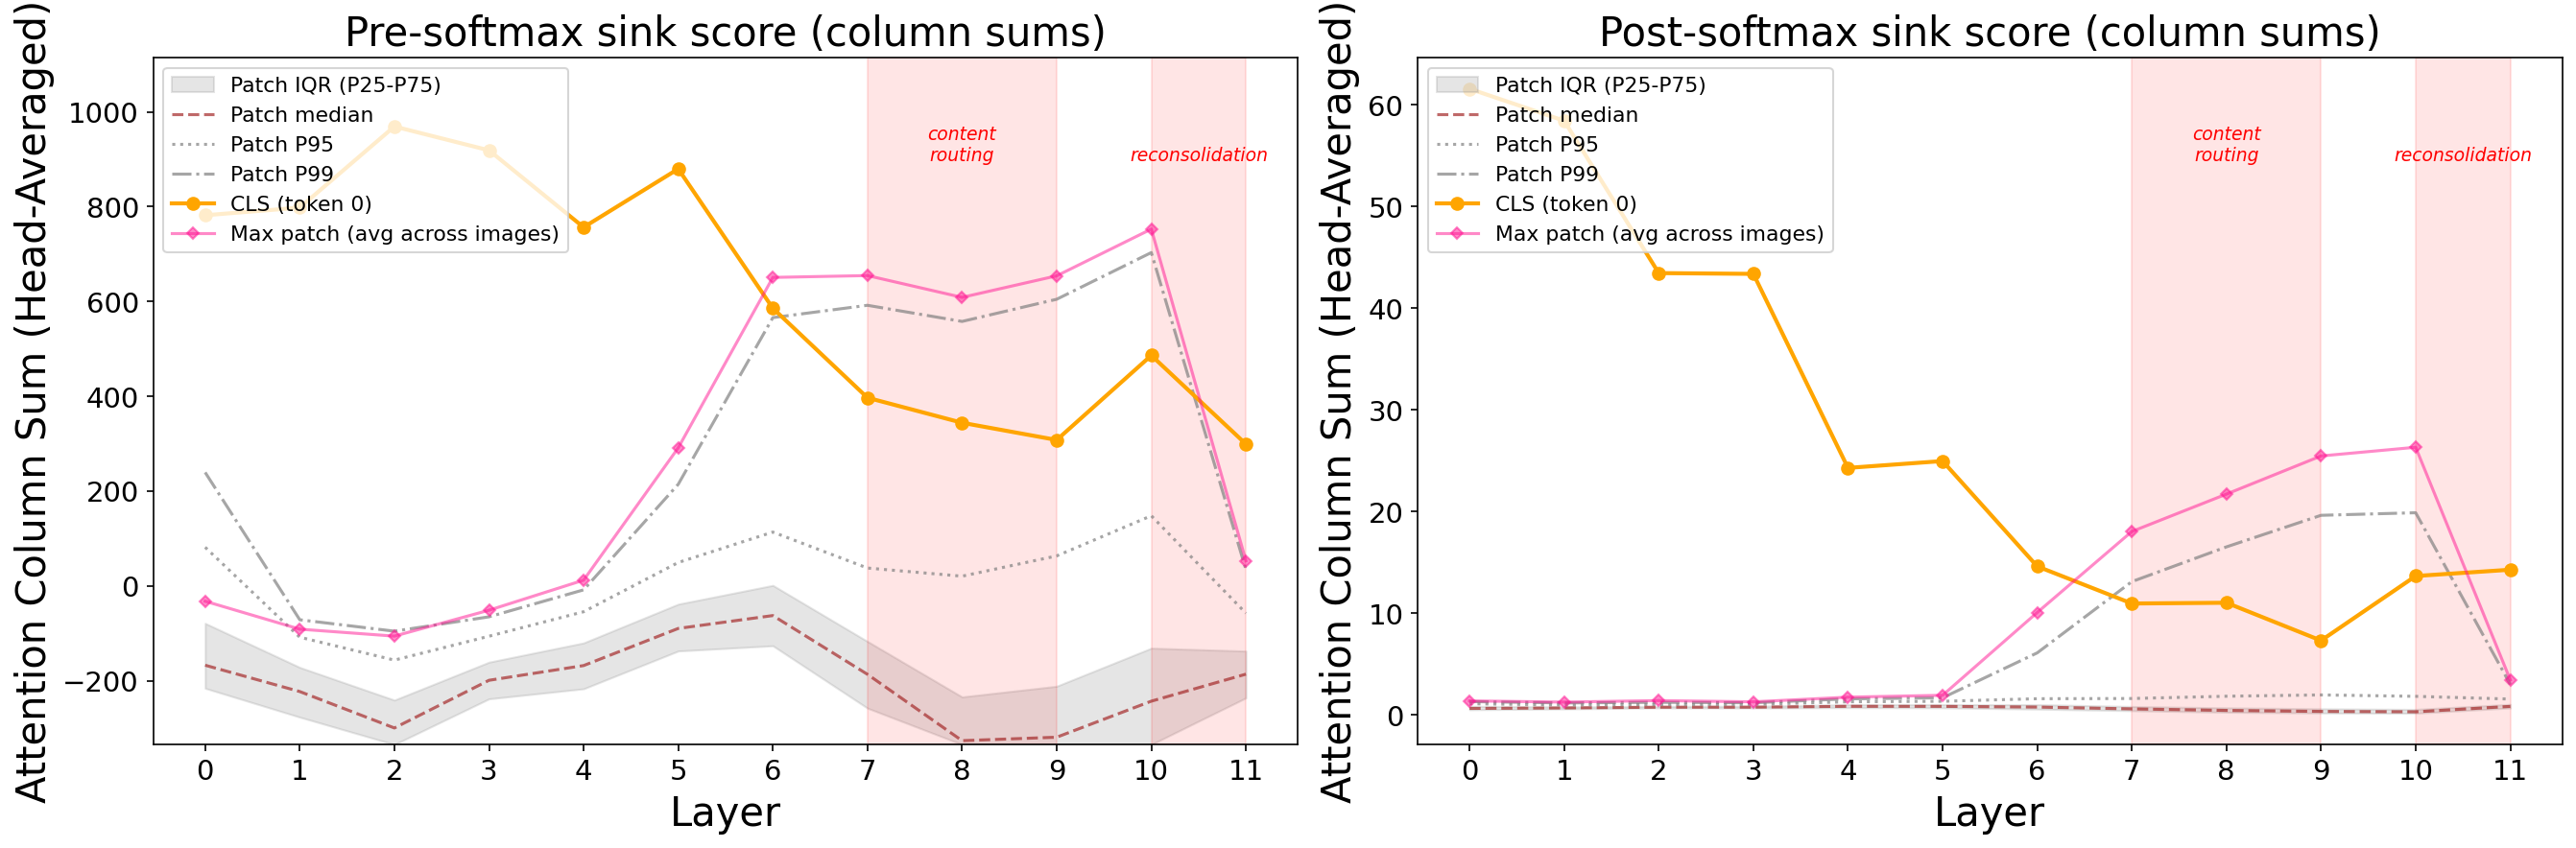
CLIP: The [CLS] token dominates early and the last layers (up to 110x concentration). But in the middle layers, something strange happens — a handful of image-dependent patch tokens briefly overtake [CLS] before it reclaims dominance at the final layer for contrastive projection. Residual norms stay flat the entire time. No explosion at all.
SigLIP: Four fixed patch tokens in the bottom-left corner lock in by layer 4 and build to 353x concentration — the strongest sinks of any model we studied. This looks nothing like CLIP, despite both being similar contrastive vision-language models.
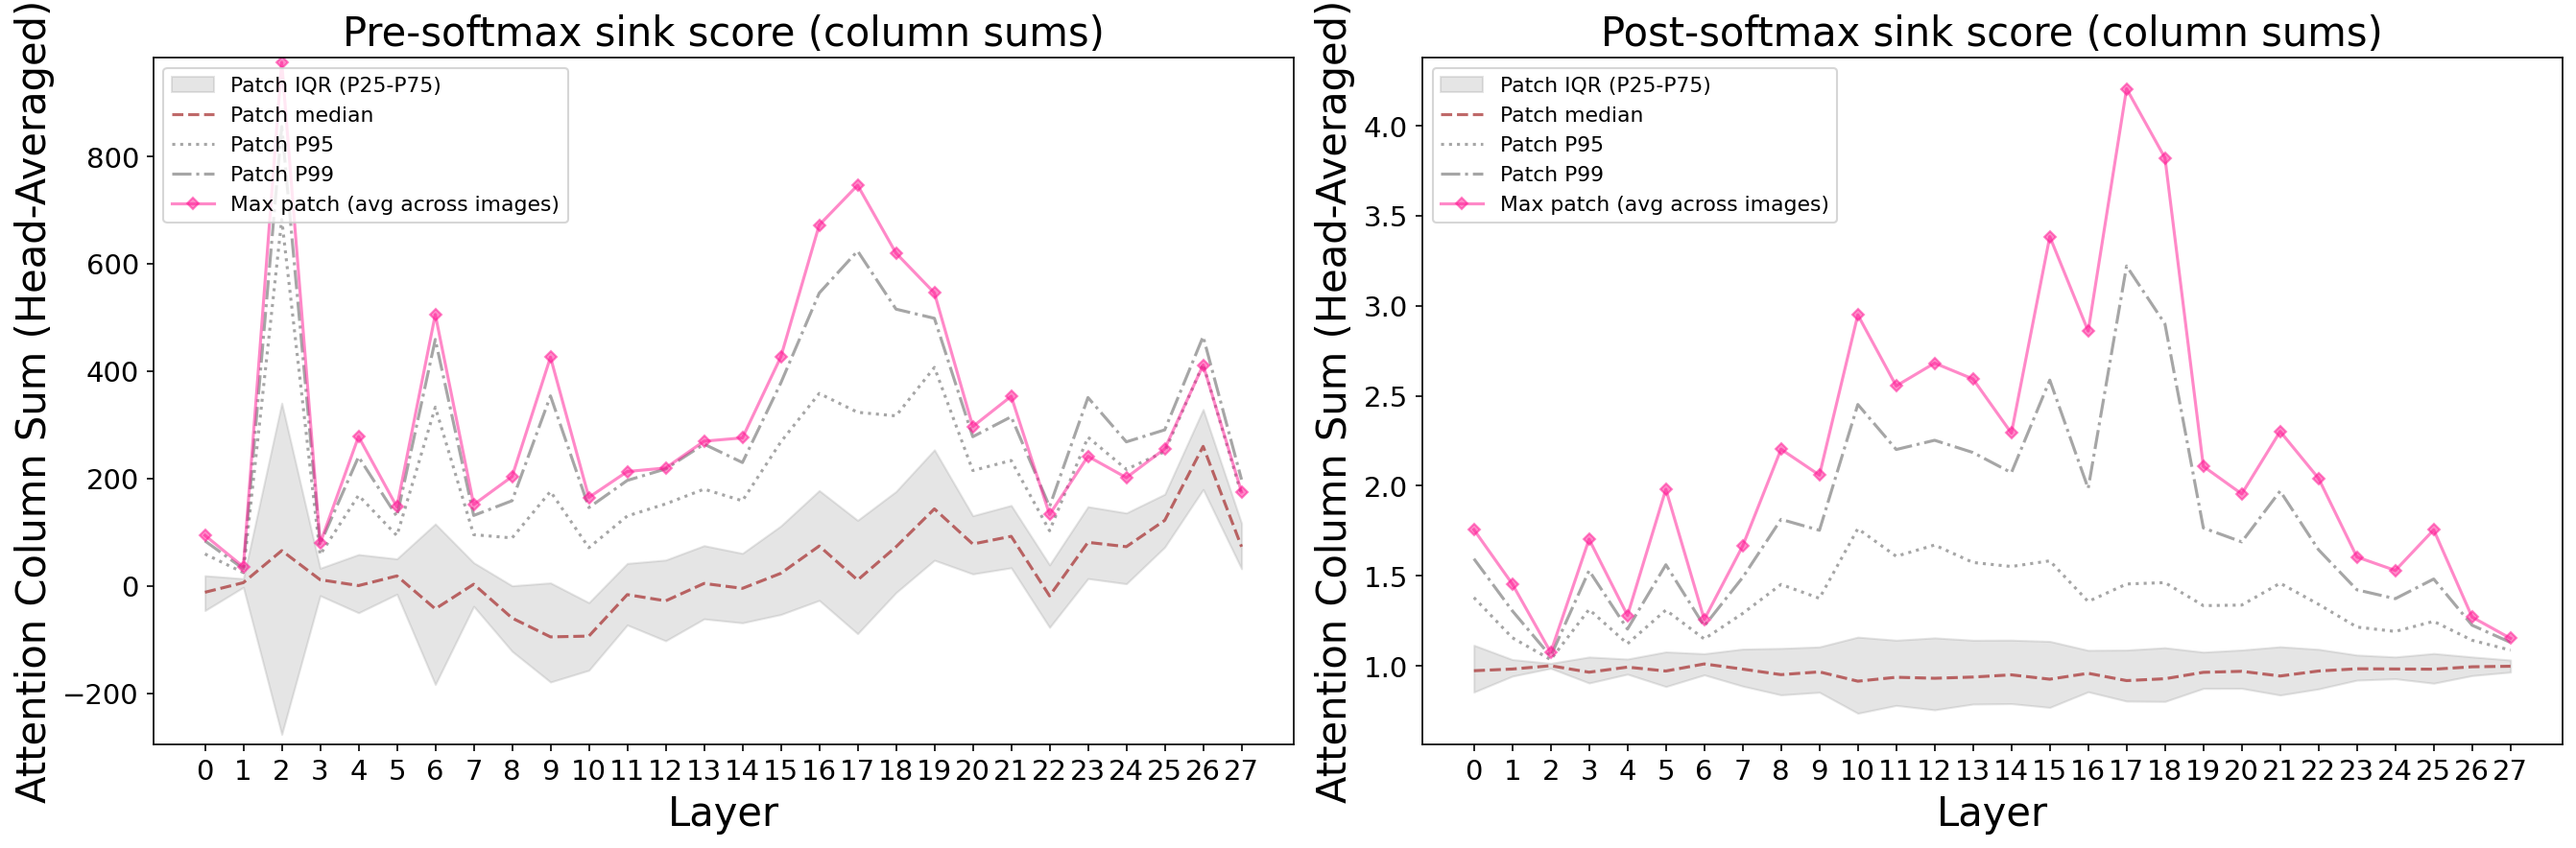
DiT: Sinks barely form. Maximum concentration: 3.7x. They rise transiently in the middle layers and then dissipate. No stable attractors, no norm explosion.
Same transformer backbone. Wildly different behavior. Why? Let’s do an in-depth case study on DINOv2 first, and then compare with the rest.
A Three-Phase Attention Sinks Lifecycle in DINOv2
DINOv2 provides the clearest mechanistic story, unfolding in three distinct phases.
Phase 1: Positional Embeddings Plant the Seed
The four corner tokens’ positional embeddings are geometrically distinctive. Their pairwise cosine similarity is 0.97 — they encode nearly the same direction. Non-sink PEs have pairwise similarity of just 0.68. Corner PE norms are 1.42x higher, decreasing monotonically toward the center.
How do we know PE is the root cause? We swapped PE vectors between corner and center positions. The result was unambiguous:
| Corner attention | Center attention | Corner norm | Center norm | |
|---|---|---|---|---|
| Baseline | 80.3 | 1.0 | 452.3 | 14.8 |
| PE swapped | 1.7 | 79.8 | 14.2 | 439.9 |
The sink follows the PE, not the spatial location. Zeroing all PEs abolishes the sinks entirely.
Phase 2: Cumulative Attention Builds Directional Coherence
The PE-seeded direction is initially coherent (sink-to-sink cosine = 0.88 at layer 0) but weakens as image content mixes in (dipping to 0.45 at layer 2). Over layers 2-8, attention repeatedly concentrates on the same four positions, writing reinforcing value vectors that gradually recover directional coherence: 0.45 → 0.62 → 0.87 → 0.93. Meanwhile, the similarity between sink and non-sink representations drops from 0.82 to 0.19 — the two groups separate in representation space.
Blocking attention at sink positions during layers 0-3 removes 98% of the downstream norm explosion. The directional foundation is built through the joint effect of the first four layers.
Phase 3: One FFN Layer Detonates
By layer 8, sink tokens carry a coherent directional signal that the FFN has learned to recognize and amplify. The numbers are stark:
| Layer | Sink pre-FFN norm | Sink post-FFN norm | FFN contribution |
|---|---|---|---|
| L7 | 5.56 | 7.78 (1.4x) | 66% |
| L8 | 7.78 | 407.0 (52.3x) | 98.6% |
| L9 | 407.0 | 452.3 (1.1x) | 88% |
At layer 7, sinks and non-sinks behave identically. At layer 8, the FFN explodes: norms jump 52x in a single layer, with the FFN contributing 98.6% of the update. By layer 9, the explosion is over. One layer, one detonation.
After this, sink representations snap to perfect directional alignment (cosine = 1.000) and stay locked through the final layers, driving 132-292x attention concentration. The feedback loop is complete.
But Wait — Aren’t High Norms the Cause?
The prevailing explanation in the literature says high residual norms produce distinctive keys that attract attention. Our three-phase story already hints otherwise — attention concentration builds from layer 0, but norms don’t explode until layer 8. If norms caused the attention, they’d need to come first.
Three causal interventions at layer 9 settle the question. Swapping key directions between sink and non-sink tokens transfers 99% of attention. Swapping key magnitudes only? Less than 2% change. Injecting 50x artificial norm inflation at non-sink tokens? Zero effect — it actually decreases sink attention by 4.5% because the inflation disrupts the learned direction.
The reason is architectural: LayerNorm divides by each token’s norm before the key projection, erasing magnitude differences. Despite 407x higher residual norms, sink key norms are only 1.07x larger — but their angular alignment with queries is 0.81 vs 0.08 for non-sinks. Direction is doing all the work. High norms and attention sinks are both downstream effects of PE-seeded directional structure — they correlate because they share a common cause, not because one produces the other.
A Taxonomy, Not a Unified Theory
With DINOv2’s mechanism mapped, we can now explain why the other models differ.
Fine-Tuning Doesn’t Fix It
Depth Anything V2, fine-tuned from DINOv2 for monocular depth estimation with all parameters updated, retains the exact same sink positions, the same three-phase mechanism, and the same causal chain. Magnitudes attenuate modestly (norm ratio: 48x → 40x, concentration: 292x → 200x), but the structural property persists. If your model is built on DINOv2, its sinks come included.
CLIP: A Completely Different Machine
CLIP shares DINOv2’s ViT-B backbone, yet none of DINOv2’s mechanism applies. The root cause isn’t positional embeddings — it’s a single learned parameter called class_embedding, added only to the CLS token. Zeroing it eliminates 99% of CLS attention. Zeroing the CLS positional embedding? A 0.5% change.
CLIP’s middle-layer patch sinks are even more interesting. They form a mutual attention clique — each attends primarily to the others, with 97-99% overlap in their top-20 attended tokens. Their representations are nearly identical to each other (cosine 0.996-0.999) and orthogonal to content tokens. At the final layer, CLS attends to these sinks 56.5x more than to regular patches.
Yet they’re completely non-functional. We progressively zeroed 2, 4, and 8 of these patch sinks during inference and evaluated zero-shot classification accuracy. The result: no change whatsoever (54.19% baseline vs 54.00-54.69% ablated, well within noise). These are true attention dumps — safe parking spots for surplus attention probability that carry zero semantic information.
SigLIP: The Key Counterexample
Here’s the twist that breaks the simplest hypothesis. You might expect SigLIP — a contrastive vision-language model like CLIP — to exhibit CLIP-like sinks. It doesn’t. SigLIP’s sinks look like DINOv2’s: fixed spatial positions, PE-driven, with the highest concentration of any model we tested (353x).
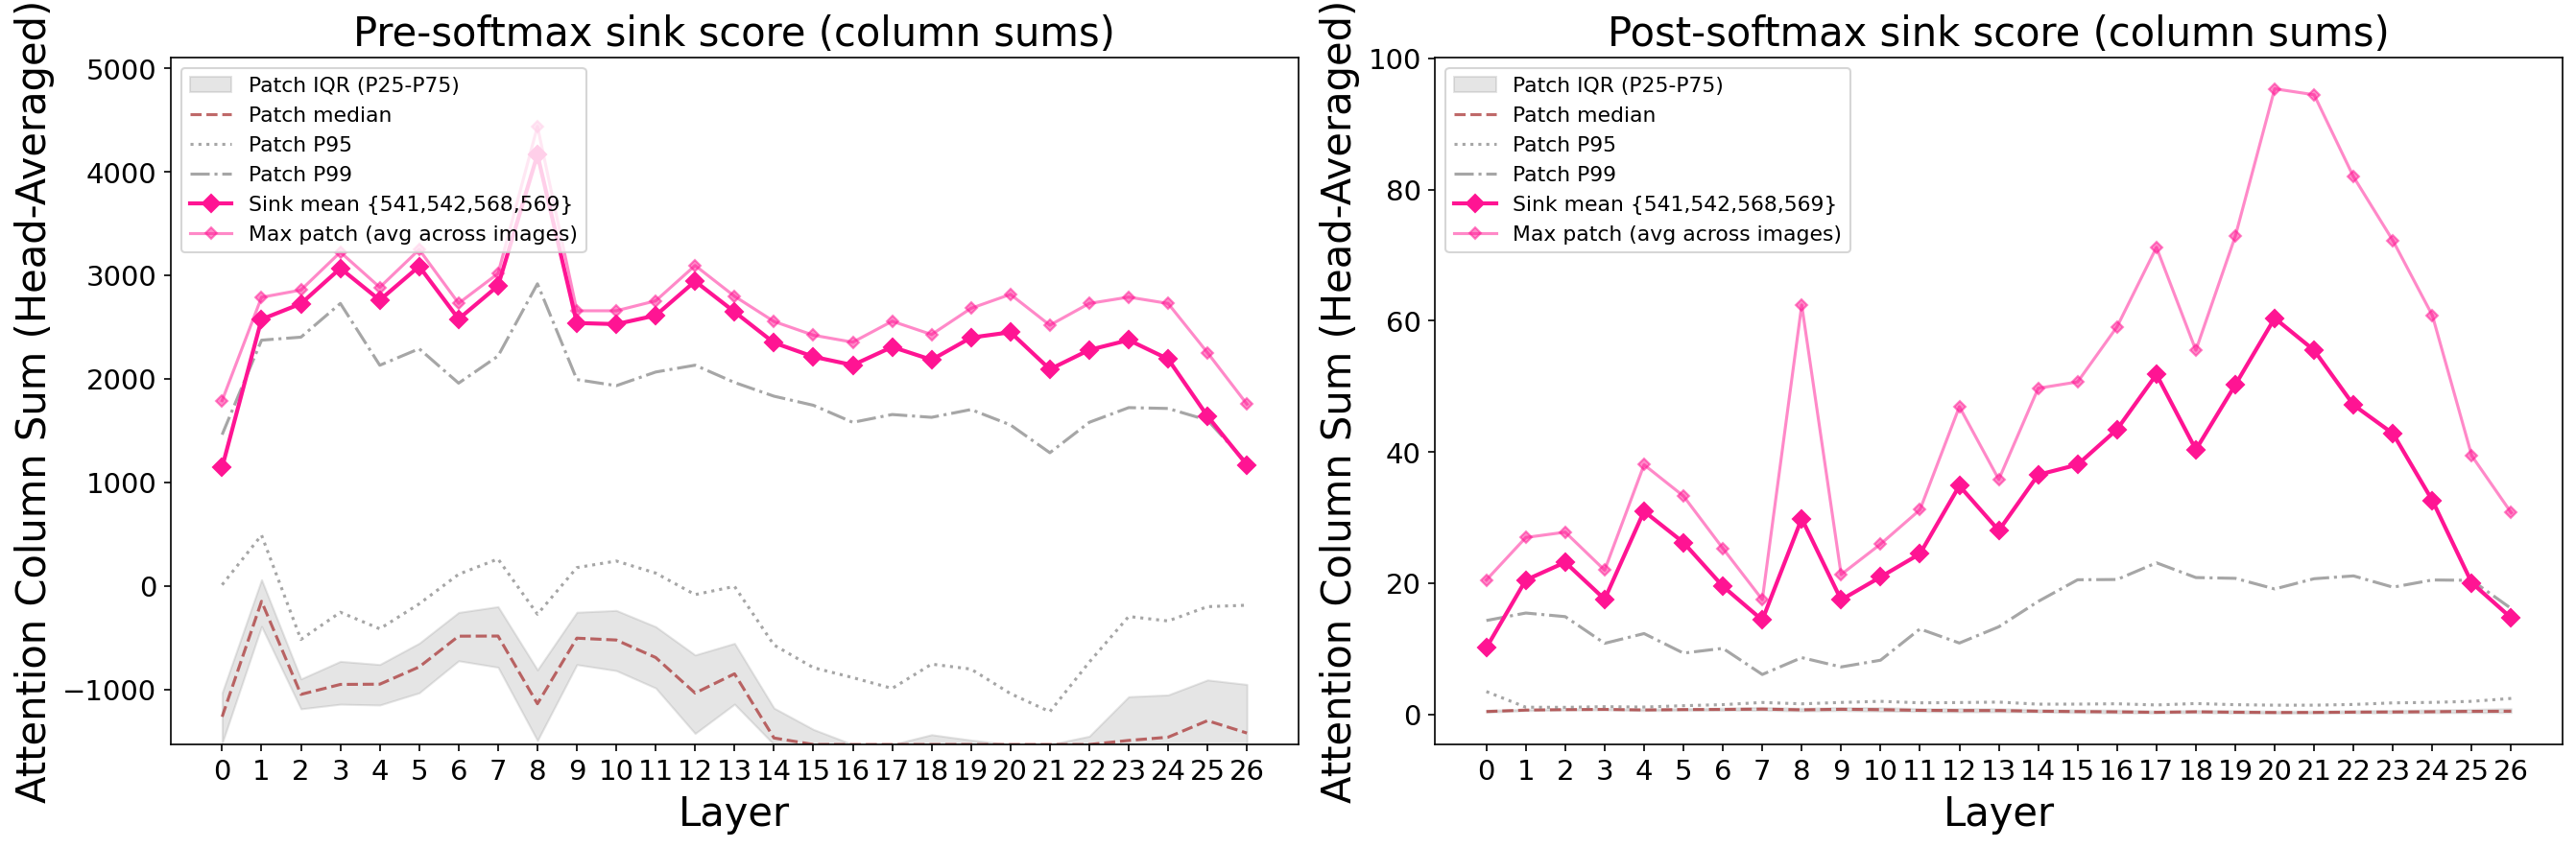
The critical architectural difference: SigLIP has no CLS token. Without a dedicated CLS to absorb surplus attention, the network must find spatial patches to serve as sinks, and PE learns to designate specific positions. Training objective doesn’t determine the mechanism — architecture does.
DiT: Natural Suppression via Gating
DiT barely develops sinks at all (maximum 3.7x vs DINOv2’s 292x). The reason is architectural: DiT uses adaLN-Zero, which applies near-zero scalar gates (approximately -0.004 for attention, -0.01 for FFN) that heavily dampen all contributions. These per-sample gates broadcast uniformly across all tokens — they can’t differentially amplify sink positions, breaking the self-reinforcing feedback loop at every step.
This is significant because it means sinks are preventable without register tokens or special training tricks. The right gating mechanism naturally suppresses the feedback loop.
The Bigger Picture
“Attention sinks” isn’t one phenomenon — it’s an umbrella term covering at least three distinct mechanisms that happen to produce similar-looking symptoms. The field has been treating a syndrome as a disease.
| DINOv2 | CLIP | SigLIP | DiT | |
|---|---|---|---|---|
| Root cause | PE geometry | class_embedding | PE geometry | PE (suppressed) |
| Sink type | Fixed corners | CLS + image-dependent patches | Fixed corners | Transient, weak |
| Concentration | 292x | 110x | 353x | 3.7x |
| Norm explosion | 48x | None (flat) | 5.6x | None (1.17x) |
| Blocking attention effect | Norms drop 80% | Norms rise 355% | Norms rise 12.5% | Norms rise 17% |
That last row is particularly telling. In DINOv2, attention at sink positions builds their norms — block it, and norms collapse. In CLIP, attention at CLS distributes information outward — block it, and information gets trapped, norms spike. Same operation, opposite effect. You can’t study one model and generalize to all the others.
Understanding this diversity matters because the downstream consequences are different, the practical mitigations are different, and the architectural lessons are different. The first step toward fixing a problem is knowing which problem you actually have.